


Scorpion Activity Map by Zip Code (1999–2025)
Field-Collected Observational Intelligence
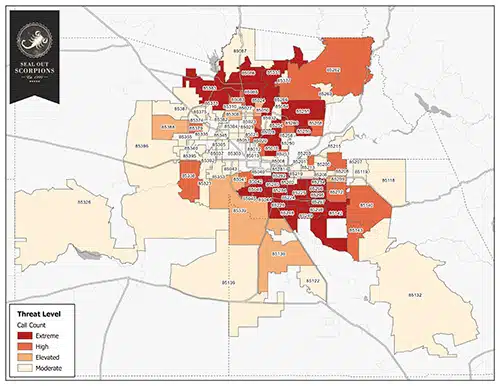
What This Map Shows
This map represents the current distribution of observed scorpion activity across the Phoenix Metro area, informed by field-collected data gathered by Seal Out Scorpions from 1999 through 2025.
The map reflects where scorpion pressure is being reported today, based on long-term, consistent observation. It is not a real-time tracker or a predictive model. Its purpose is to help homeowners and communities understand regional patterns of scorpion pressure as they exist now, informed by more than two decades of data collection.
How to Read This Map
This map visualizes relative scorpion pressure by zip code, not confirmed scorpion counts.
Shaded areas reflect normalized activity intensity, meaning reported scorpion inquiries were evaluated relative to the residential population within each zip code. This approach helps account for differences in population density, recognizing that the same number of reports can represent very different levels of relative activity in areas with fewer residents versus more densely populated zip codes.
Because this map is based on observational data:
- It is best used to understand regional conditions
- Individual properties may experience very different outcomes
- Presence or absence cannot be guaranteed for any specific home
How This Map Was Constructed
This map is based on:
- Inbound homeowner inquiries and reports to Seal Out Scorpions
- Both job and non-job contacts
- Consistent intake practices over multiple decades
- Geographic aggregation by zip code
Reported activity was adjusted relative to residential population, rather than displayed as raw report counts. This normalization helps create a more meaningful comparison across zip codes with very different population sizes.
Seal Out Scorpions represents one data source, not a universal reporting system. While not all scorpion activity is captured, the company has become a long-standing regional authority, and consistent data collection over time allows for reliable relative comparison across areas.
What This Map Represents
- The current regional distribution of observed scorpion pressure
- Long-term field observation compiled into a present-state view
- Relative activity intensity adjusted for population differences
What This Map Does NOT Represent
For clarity, this map is not:
- A census of scorpion populations
- A real-time monitoring system
- A guarantee of presence or absence
- A predictive or forecasting model
It is an observational snapshot, informed by long-term data.
Observed Change Over Time
While the map above reflects current conditions, its interpretation is informed by earlier versions of this map compiled using 1999–2016 data.
Comparing earlier versions to the current map reveals several broad changes:
- Scorpion activity was once more localized, with clearer separation between higher- and lower-activity areas
- Activity is now more continuous across the Valley
- Fewer low-pressure buffer zones remain
- Increased relative pressure is observed in areas that historically generated fewer inquiries, including some higher-end and previously insulated neighborhoods
These observations suggest that scorpion pressure has shifted from isolated pockets toward a broader regional condition.
Historical Reference: Change Over Time
Scorpion Activity Map (1999–2016)

Scorpion Activity Map (1999–2025)
These static maps are provided for historical context only. They illustrate how reported scorpion pressure has shifted over time from more localized pockets to a broader regional distribution. For present-day interpretation, refer to the primary interactive map above.
Why Scorpion Pressure Has Increased
Based on decades of field observation, increased scorpion activity appears to be influenced by multiple overlapping conditions, rather than a single cause.
Commonly observed factors include:
- Urban growth, redevelopment, and remodeling that create shelter and structural voids
- Landscaping and irrigation practices that support prey populations
- Changes in pest control products and application practices
- Longer warm seasons and altered weather patterns
- Increased use of hardscape and artificial turf, which can shift heat and moisture conditions
These conditions interact differently from neighborhood to neighborhood, which is why scorpion pressure can vary widely even within the same zip code.
Questions We Continue to Observe
As conditions continue to change, several questions remain important:
- How will ongoing development and remodeling affect scorpion movement patterns?
- Will prolonged warm seasons continue to extend activity periods?
- How do newer landscaping materials influence heat and shelter dynamics?
- How do changes in pest control practices affect scorpion behavior rather than elimination?
- What additional environmental factors may emerge over time?
These questions are best addressed through continued observation and structural prevention, rather than short-term reaction.
Why This Matters for Homeowners
Scorpion issues are typically easiest to address before activity becomes established.
Understanding regional conditions can help homeowners:
- Recognize risk earlier
- Make informed prevention decisions
- Focus on exclusion and habitat reduction
- Avoid relying solely on short-term chemical treatments
In many cases, scorpion problems develop gradually as conditions accumulate over time.
Request Insight for Your Area or Home
If you’re living in a home or considering a purchase and want help understanding how scorpion activity in your area may affect a specific property, request guidance below.
Media Use & Attribution
This scorpion activity map may be referenced or reproduced by news organizations, educators, and public-interest outlets without prior permission, provided proper attribution is given.
Source: Seal Out Scorpions — field-collected observational data normalized by population (1999–2025).
This map reflects reported activity patterns, not a population census or real-time tracking system.